Brand
A recognizable direction that connects the subject of sustainability with a calm, confident visual language.
Branding · Design
Making sustainability data easier to understand, compare, and act on.
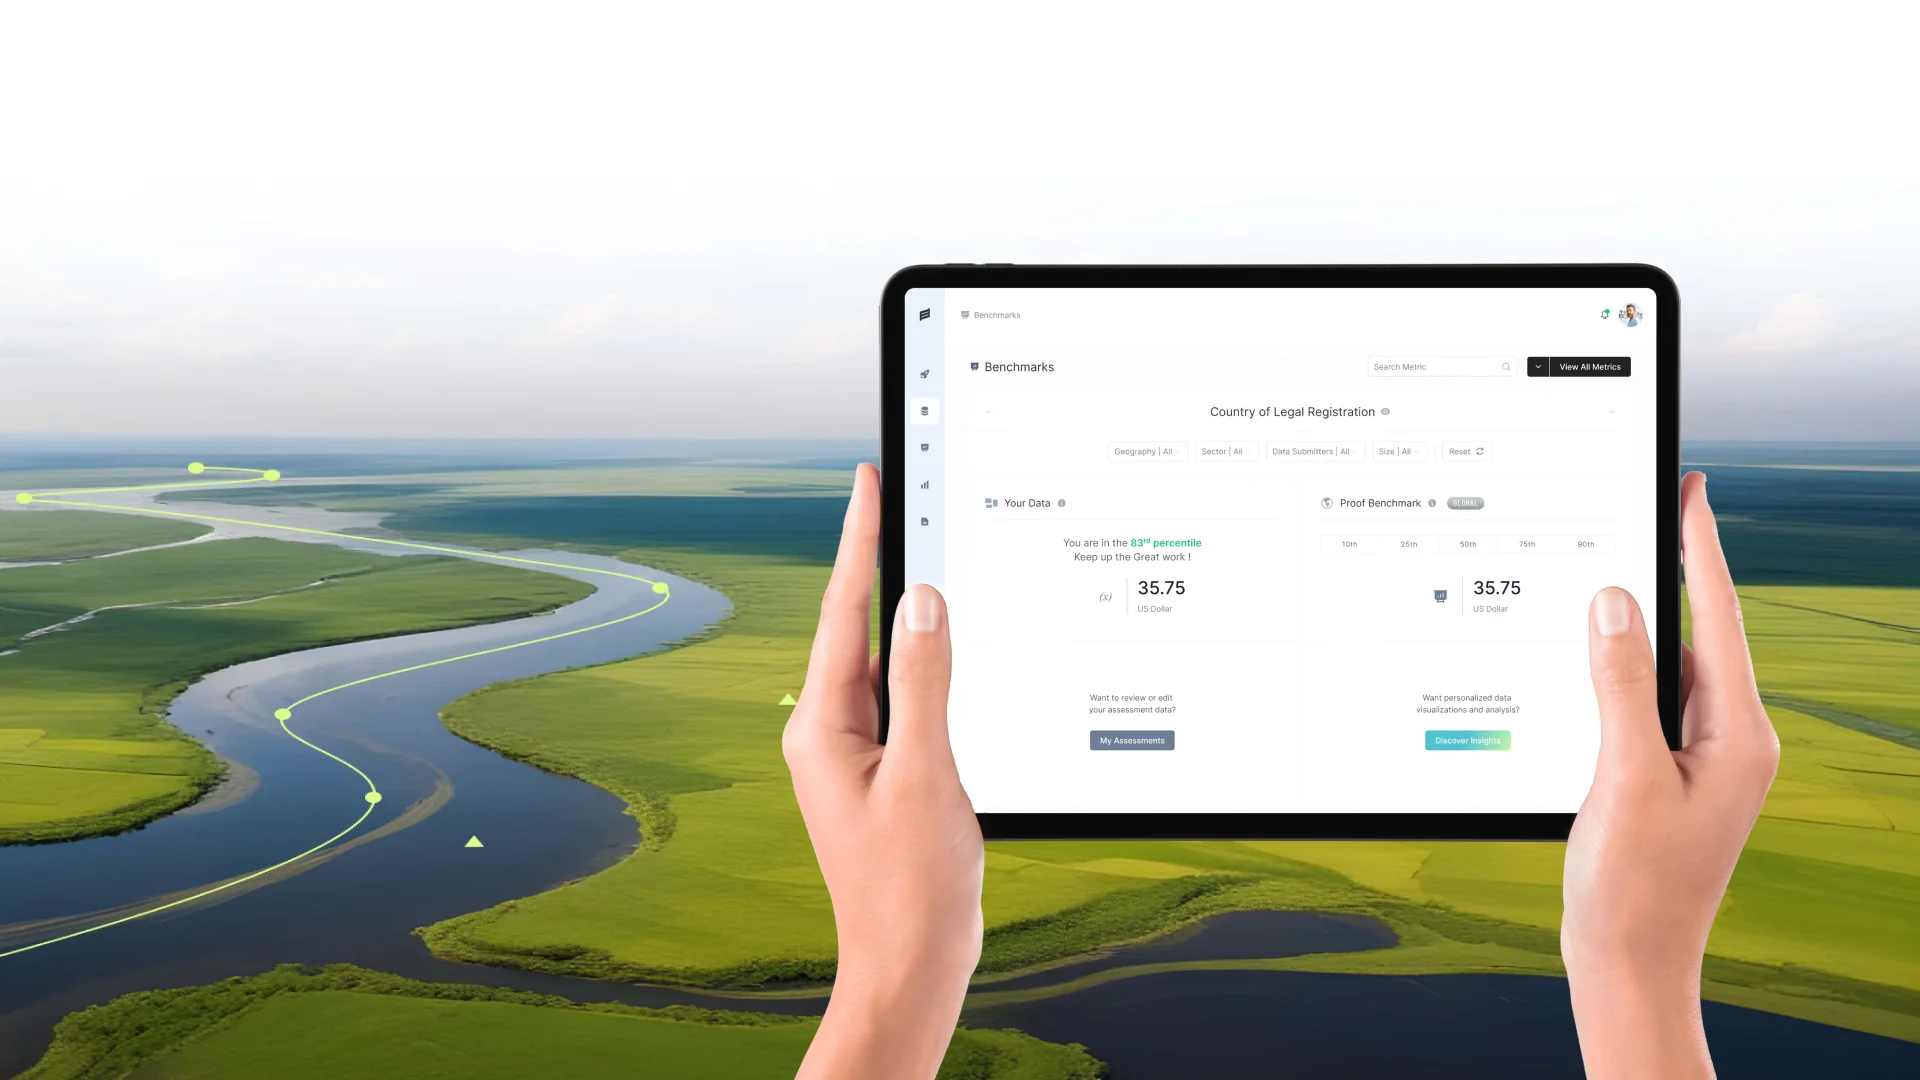
Proof brings sustainability information into one place. The design challenge was to make that information feel connected, understandable, and useful.
Sustainability reporting spans environmental, social, and governance measures. A single report can contain emissions figures, organizational data, progress over time, and comparisons with other reporting partners. Each measure tells part of the story; the experience needs to help people see how those parts fit together.
Our direction connects the product interface with a calm, recognizable visual language. Clear typography, considered spacing, and a restrained palette give the data room to speak. The emphasis is on helping someone move from a broad overview into the details that matter, without losing the context of what they are reviewing.
The work is presented as one system: the reporting experience, the visual foundations behind it, and the ways those foundations can carry across future screens. Product mockups sit alongside mood boards, palette studies, and component explorations so the reasoning behind the design remains visible.
The difficult part is not displaying more data. It is helping people understand what they are looking at, what it relates to, and where to look next.
Different measures need different kinds of context. An emissions total, an intensity figure, and a percentage cannot be read in the same way. Units, reporting periods, and the source of a result all influence its meaning. If those details are visually disconnected from the value, a clean-looking dashboard can still be difficult to interpret.
Comparison adds another layer. Someone reviewing a report may need to understand how a result has changed over time, how it compares with a benchmark, or which organizations are included. Filters need to remain easy to find, while summaries and detailed results need to feel like parts of the same view. The challenge is to preserve that relationship as the amount of information grows.
There is also a balance between product clarity and brand character. Too much decoration competes with the data; too little distinction makes the experience feel anonymous. The visual direction therefore needs enough personality to be recognizable, with a consistent structure that supports careful reading across reporting screens and different display sizes.
Three principles guide the relationship between the brand and the interface. They provide a practical way to judge layout, typography, color, and content together, rather than treating each screen as an isolated composition.
Start with the information someone needs to orient themselves, then reveal the detail that supports it. Distinct levels for report context, metric labels, values, and supporting information make the page easier to scan. A prominent number should always keep its label and unit close enough to remain meaningful.
Give recurring information a familiar place and treatment. Filters, category labels, result cards, and comparison tables should follow the same underlying rules. Repetition helps people carry what they have learned from one view to another, while giving the team a coherent foundation for additional product screens.
Use color, emphasis, and space with a clear purpose. Neutral surfaces keep dense information readable; teal and supporting colors can distinguish categories and meaningful states. Quiet visual foundations make it possible to introduce expressive brand imagery without asking the interface itself to compete for attention.
A reporting experience organized around a simple reading sequence: understand the overview, set the context, then compare the detail.
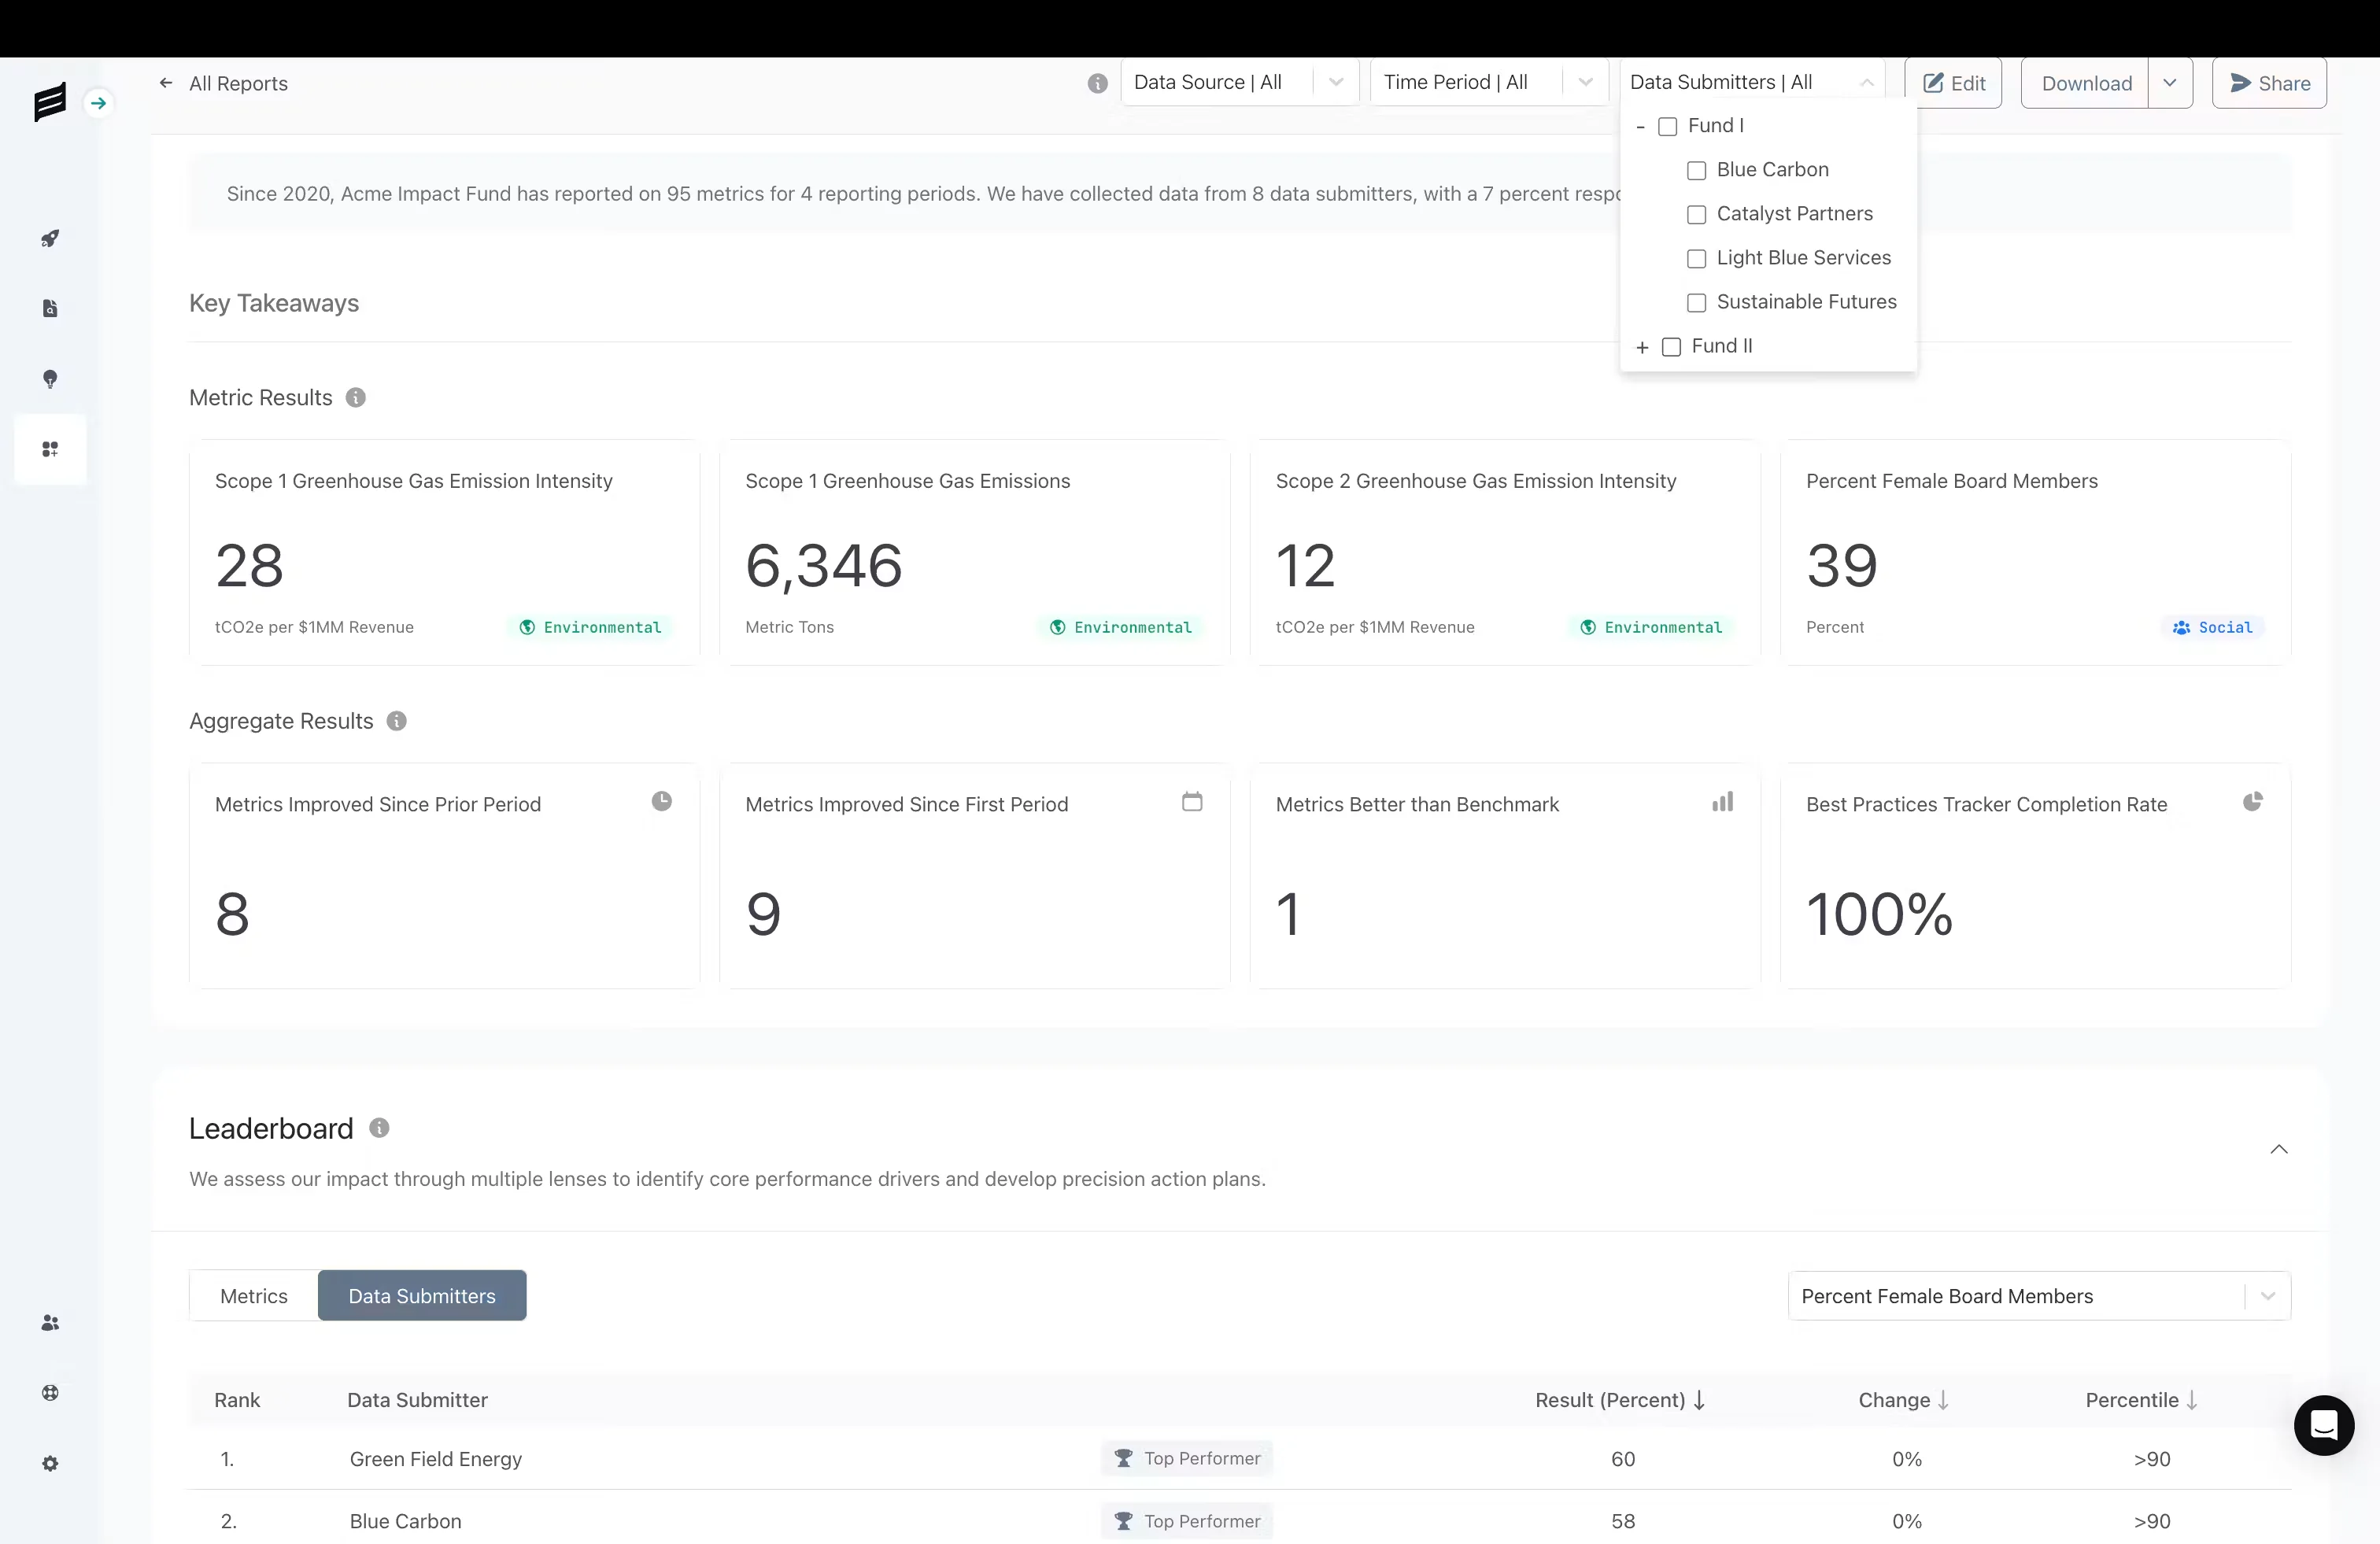
The report view gives key results a clear starting point. Metric labels, values, and units stay together, while category cues help distinguish environmental and social measures. Aggregate results provide a second layer of information, allowing the page to move from individual measures toward a broader view of progress.
Filters sit near the report controls so the selected data source, reporting period, and submitters remain part of the reading context. Below the summary, a comparison table offers a more detailed view of reporting partners. Consistent alignment and spacing connect these different forms of information without making them look identical.
The same hierarchy informs the presentation at smaller sizes. Supporting controls can move into their own rows and dense groups can stack in a clear order. The aim is to preserve the relationship between a result and its context, rather than simply compressing a desktop composition into less space.
The visual foundations belong to the same story as the product. Mood, color, identity, and interface components need to support one another.
Proof’s visual world pairs confident navy with a single, energetic lime accent. Lime (#E2FF3E) marks action and progress; deep navy (#0F172A) and ink (#111827) give text and data authority; soft blue (#EEF5FF) and off-white (#F8F9FA) keep dense information calm.
A signature gradient runs from cool blue through warm cream to lime, used for moments of insight and for the platform’s hero surfaces. Photography focuses on the people Proof serves, advisors, investors and legal teams, in blue-toned, professional settings.
Illustrations use frosted-glass cards with soft light, turning abstract ideas such as data procurement, compliance and benchmarking into tangible objects. Inter carries the interface and Lexend gives headlines a friendly, modern voice.



A connected direction for the brand, the reporting experience, and the system that supports future work.
The work brings visual character and information structure into closer alignment. Instead of asking each part of the experience to establish its own language, the direction connects report summaries, detailed comparisons, imagery, and identity through shared decisions about type, color, and space.
The strongest outcome is a clear foundation to build on. The product screens show how complex information can be organized; the visual studies explain the tone behind it; and the component explorations make recurring decisions easier to carry forward. Together, they give the next iteration a considered starting point.
A recognizable direction that connects the subject of sustainability with a calm, confident visual language.
A readable hierarchy that brings report context, key results, and deeper comparisons into one continuous view.
A shared set of visual and component studies that gives future product and brand work a consistent starting point.
We’re preparing the project context, design decisions, and visuals. Explore the rest of our work in the meantime.
Back to work